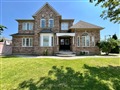
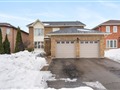
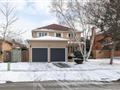
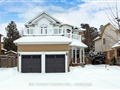
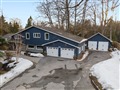
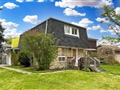
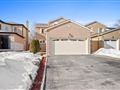
93 Fallingbrook St
$1,228,033
Comparative Market Analysis
Jul 5, 2025
NOT AN ACTIVE LISTING
Historical Performance
| Period | $ Change | % Change |
| 1 Day | +$352 | +0.029% |
| 7 Days | +$252 | +0.020% |
| 30 Days | -$2,080 | -0.169% |
| 3 Months | -$3,398 | -0.276% |
| 6 Months | +$20.5k | +1.70% |
| 1 Year | -$56.1k | -4.37% |
| 3 Years | +$222k | +22.1% |
| 5 Years | +$375k | +43.9% |
| 10 Years | +$739k | +151% |
List My Property
Real Estate Statistics
Financing Solutions
AS SEEN ON


Are You a Licensed Real Estate Agent or Broker?