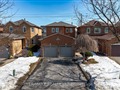
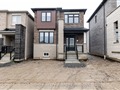
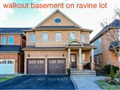
53 Lady May Dr
$1,009,549
Comparative Market Analysis
Jul 9, 2025
NOT AN ACTIVE LISTING
Historical Performance
| Period | $ Change | % Change |
| 1 Day | +$287 | +0.028% |
| 7 Days | +$185 | +0.018% |
| 30 Days | -$1,798 | -0.178% |
| 3 Months | -$3,039 | -0.300% |
| 6 Months | +$16.4k | +1.65% |
| 1 Year | -$47.1k | -4.46% |
| 3 Years | +$177k | +21.2% |
| 5 Years | +$321k | +46.6% |
| 10 Years | +$597k | +144% |
List My Property
Real Estate Statistics
Financing Solutions
AS SEEN ON


Are You a Licensed Real Estate Agent or Broker?