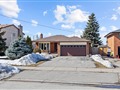
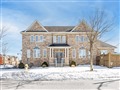
41 Lowder Pl
$856,704
Comparative Market Analysis
Jul 5, 2025
NOT AN ACTIVE LISTING
Historical Performance
| Period | $ Change | % Change |
| 1 Day | +$245 | +0.029% |
| 7 Days | +$159 | +0.019% |
| 30 Days | -$1,530 | -0.178% |
| 3 Months | -$2,631 | -0.306% |
| 6 Months | +$13.7k | +1.63% |
| 1 Year | -$40.6k | -4.52% |
| 3 Years | +$158k | +22.7% |
| 5 Years | +$276k | +47.5% |
| 10 Years | +$521k | +155% |
List My Property
Real Estate Statistics
Financing Solutions
Browsing History
4 Mayflower St, Whitby
2 seconds ago
35 William Stephenson Dr, Whitby
3 seconds ago
33 Perkinsfield St, Whitby
4 seconds ago
5 Yarmouth Crt, Whitby
5 seconds ago
93 Grath Cres, Whitby
6 seconds ago
21 Mayflower St, Whitby
6 seconds ago
AS SEEN ON


Are You a Licensed Real Estate Agent or Broker?