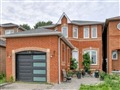
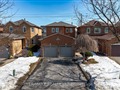
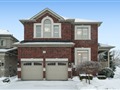
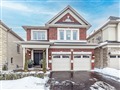
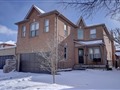
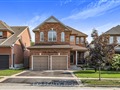
41 Fencerow Dr
$1,048,497
Comparative Market Analysis
Jul 6, 2025
NOT AN ACTIVE LISTING
Historical Performance
| Period | $ Change | % Change |
| 1 Day | +$298 | +0.028% |
| 7 Days | +$363 | +0.035% |
| 30 Days | -$990 | -0.094% |
| 3 Months | +$39 | +0.004% |
| 6 Months | +$24.7k | +2.41% |
| 1 Year | -$27.4k | -2.54% |
| 3 Years | +$234k | +28.8% |
| 5 Years | +$372k | +55.0% |
| 10 Years | +$659k | +169% |
List My Property
Real Estate Statistics
Financing Solutions
Browsing History
37 Porcelain Way, Whitby
5 seconds ago
6 Inverary Crt, Whitby
10 seconds ago
48 Fencerow Dr, Whitby
15 seconds ago
18 Fencerow Dr, Whitby
20 seconds ago
AS SEEN ON

Are You a Licensed Real Estate Agent or Broker?