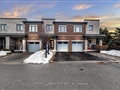
33 Tallships Dr
$802,234
Comparative Market Analysis
Jul 10, 2025
NOT AN ACTIVE LISTING
Historical Performance
| Period | $ Change | % Change |
| 1 Day | +$410 | +0.051% |
| 7 Days | +$916 | +0.114% |
| 30 Days | -$1,171 | -0.146% |
| 3 Months | -$3,824 | -0.474% |
| 6 Months | +$10.1k | +1.28% |
| 1 Year | -$40.8k | -4.84% |
| 3 Years | +$122k | +17.9% |
| 5 Years | +$225k | +38.9% |
| 10 Years | +$437k | +120% |
List My Property
Real Estate Statistics
Financing Solutions
AS SEEN ON


Are You a Licensed Real Estate Agent or Broker?