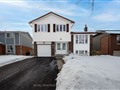
26 Ingram Crt
$942,572
Comparative Market Analysis
Jun 4, 2025
NOT AN ACTIVE LISTING
Historical Performance
| Period | $ Change | % Change |
| 1 Day | +$262 | +0.028% |
| 7 Days | +$140 | +0.015% |
| 30 Days | -$1,783 | -0.189% |
| 3 Months | -$3,089 | -0.327% |
| 6 Months | +$14.9k | +1.60% |
| 1 Year | -$45.3k | -4.59% |
| 3 Years | +$180k | +23.6% |
| 5 Years | +$304k | +47.6% |
| 10 Years | +$571k | +154% |
List My Property
Real Estate Statistics
Financing Solutions
AS SEEN ON


Are You a Licensed Real Estate Agent or Broker?