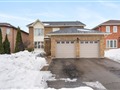
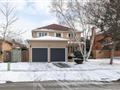
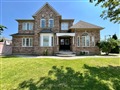
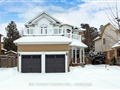
23 Waywell St
$1,329,526
Comparative Market Analysis
Jun 21, 2025
NOT AN ACTIVE LISTING
Historical Performance
| Period | $ Change | % Change |
| 1 Day | +$381 | +0.029% |
| 7 Days | +$221 | +0.017% |
| 30 Days | -$2,505 | -0.188% |
| 3 Months | -$4,514 | -0.338% |
| 6 Months | +$20.4k | +1.56% |
| 1 Year | -$65.0k | -4.66% |
| 3 Years | +$226k | +20.4% |
| 5 Years | +$378k | +39.7% |
| 10 Years | +$771k | +138% |
List My Property
Real Estate Statistics
Financing Solutions
AS SEEN ON


Are You a Licensed Real Estate Agent or Broker?