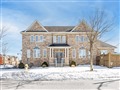
113 Allan St
$865,986
Comparative Market Analysis
Jul 5, 2025
NOT AN ACTIVE LISTING
Historical Performance
| Period | $ Change | % Change |
| 1 Day | +$248 | +0.029% |
| 7 Days | +$475 | +0.055% |
| 30 Days | +$30 | +0.003% |
| 3 Months | +$2,787 | +0.323% |
| 6 Months | +$26.1k | +3.11% |
| 1 Year | -$8,666 | -0.991% |
| 3 Years | +$269k | +45.0% |
| 5 Years | +$350k | +67.7% |
| 10 Years | +$510k | +143% |
List My Property
Real Estate Statistics
Financing Solutions
Browsing History
21 Dunbar Dr, Whitby
1 second ago
7 Dunbar Dr, Whitby
1 second ago
12 Dunbar Dr, Whitby
1 second ago
AS SEEN ON


Are You a Licensed Real Estate Agent or Broker?