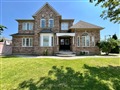
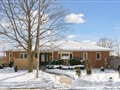
110 Fallingbrook St
$1,276,918
Comparative Market Analysis
Jul 5, 2025
NOT AN ACTIVE LISTING
Historical Performance
| Period | $ Change | % Change |
| 1 Day | +$366 | +0.029% |
| 7 Days | +$470 | +0.037% |
| 30 Days | -$1,102 | -0.086% |
| 3 Months | +$256 | +0.020% |
| 6 Months | +$30.2k | +2.42% |
| 1 Year | -$33.7k | -2.57% |
| 3 Years | +$306k | +31.5% |
| 5 Years | +$357k | +38.8% |
| 10 Years | +$788k | +161% |
List My Property
Real Estate Statistics
Financing Solutions
Browsing History
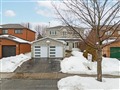
32 Winter Crt, Whitby
4 seconds ago
AS SEEN ON


Are You a Licensed Real Estate Agent or Broker?