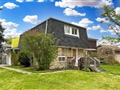
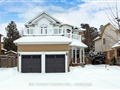
11 Candlebrook Dr
$1,096,169
Comparative Market Analysis
Jul 5, 2025
NOT AN ACTIVE LISTING
Historical Performance
| Period | $ Change | % Change |
| 1 Day | +$314 | +0.029% |
| 7 Days | +$383 | +0.035% |
| 30 Days | -$1,040 | -0.095% |
| 3 Months | -$16 | -0.001% |
| 6 Months | +$25.6k | +2.39% |
| 1 Year | -$29.0k | -2.58% |
| 3 Years | +$275k | +33.6% |
| 5 Years | +$435k | +65.8% |
| 10 Years | +$684k | +166% |
List My Property
Real Estate Statistics
Financing Solutions
AS SEEN ON


Are You a Licensed Real Estate Agent or Broker?